Mapbox GL JS is a powerful mapping API, that can create really nice data visualizations and styling. Their maps look really clean and do a nice job at communicating engaging information interactively.
That said, getting started with Mapbox, and it's data driven styling may not be completely straightforward, and required me to do a little testing to get started. For this post, I'll be sharing notes on how this great tool works, using the example Mapbox has provided.
Style circles with a data-driven property
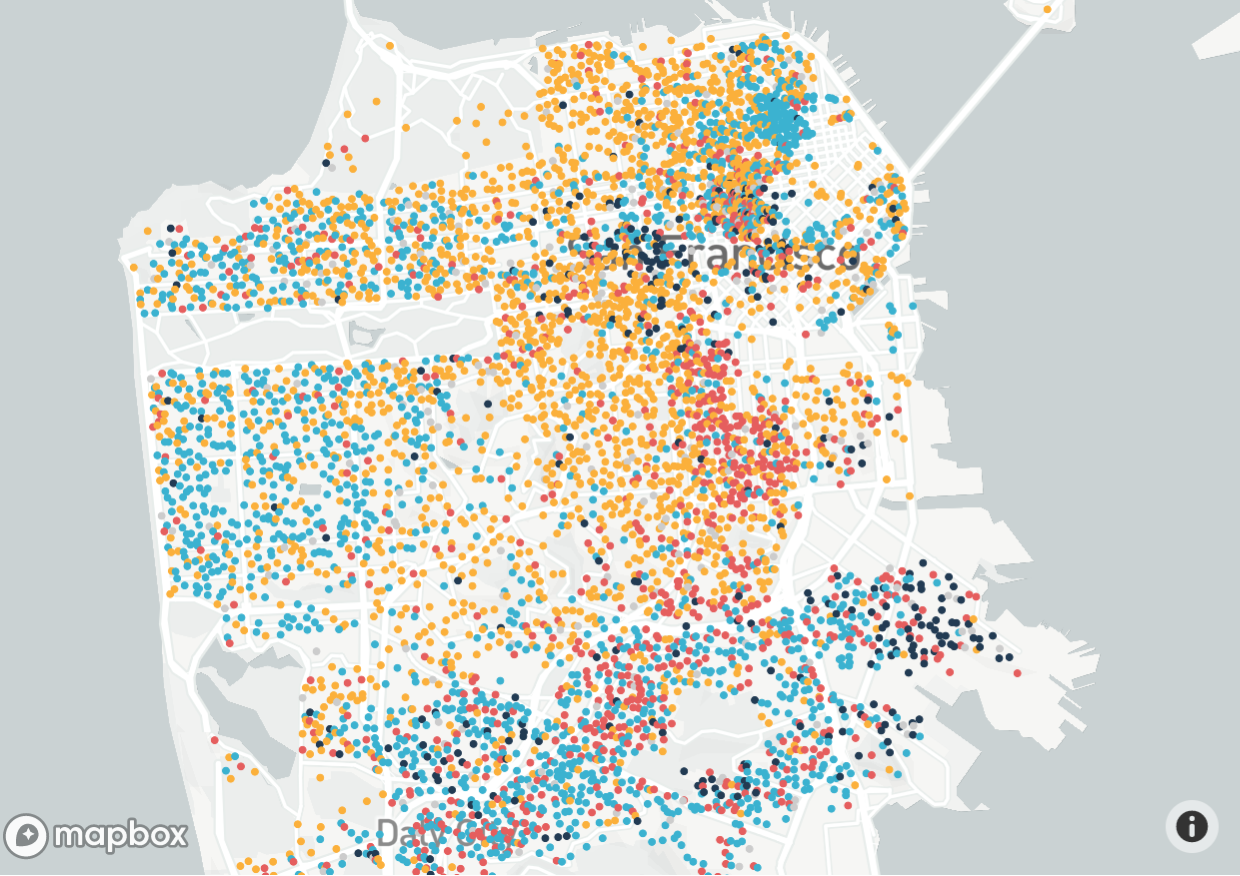
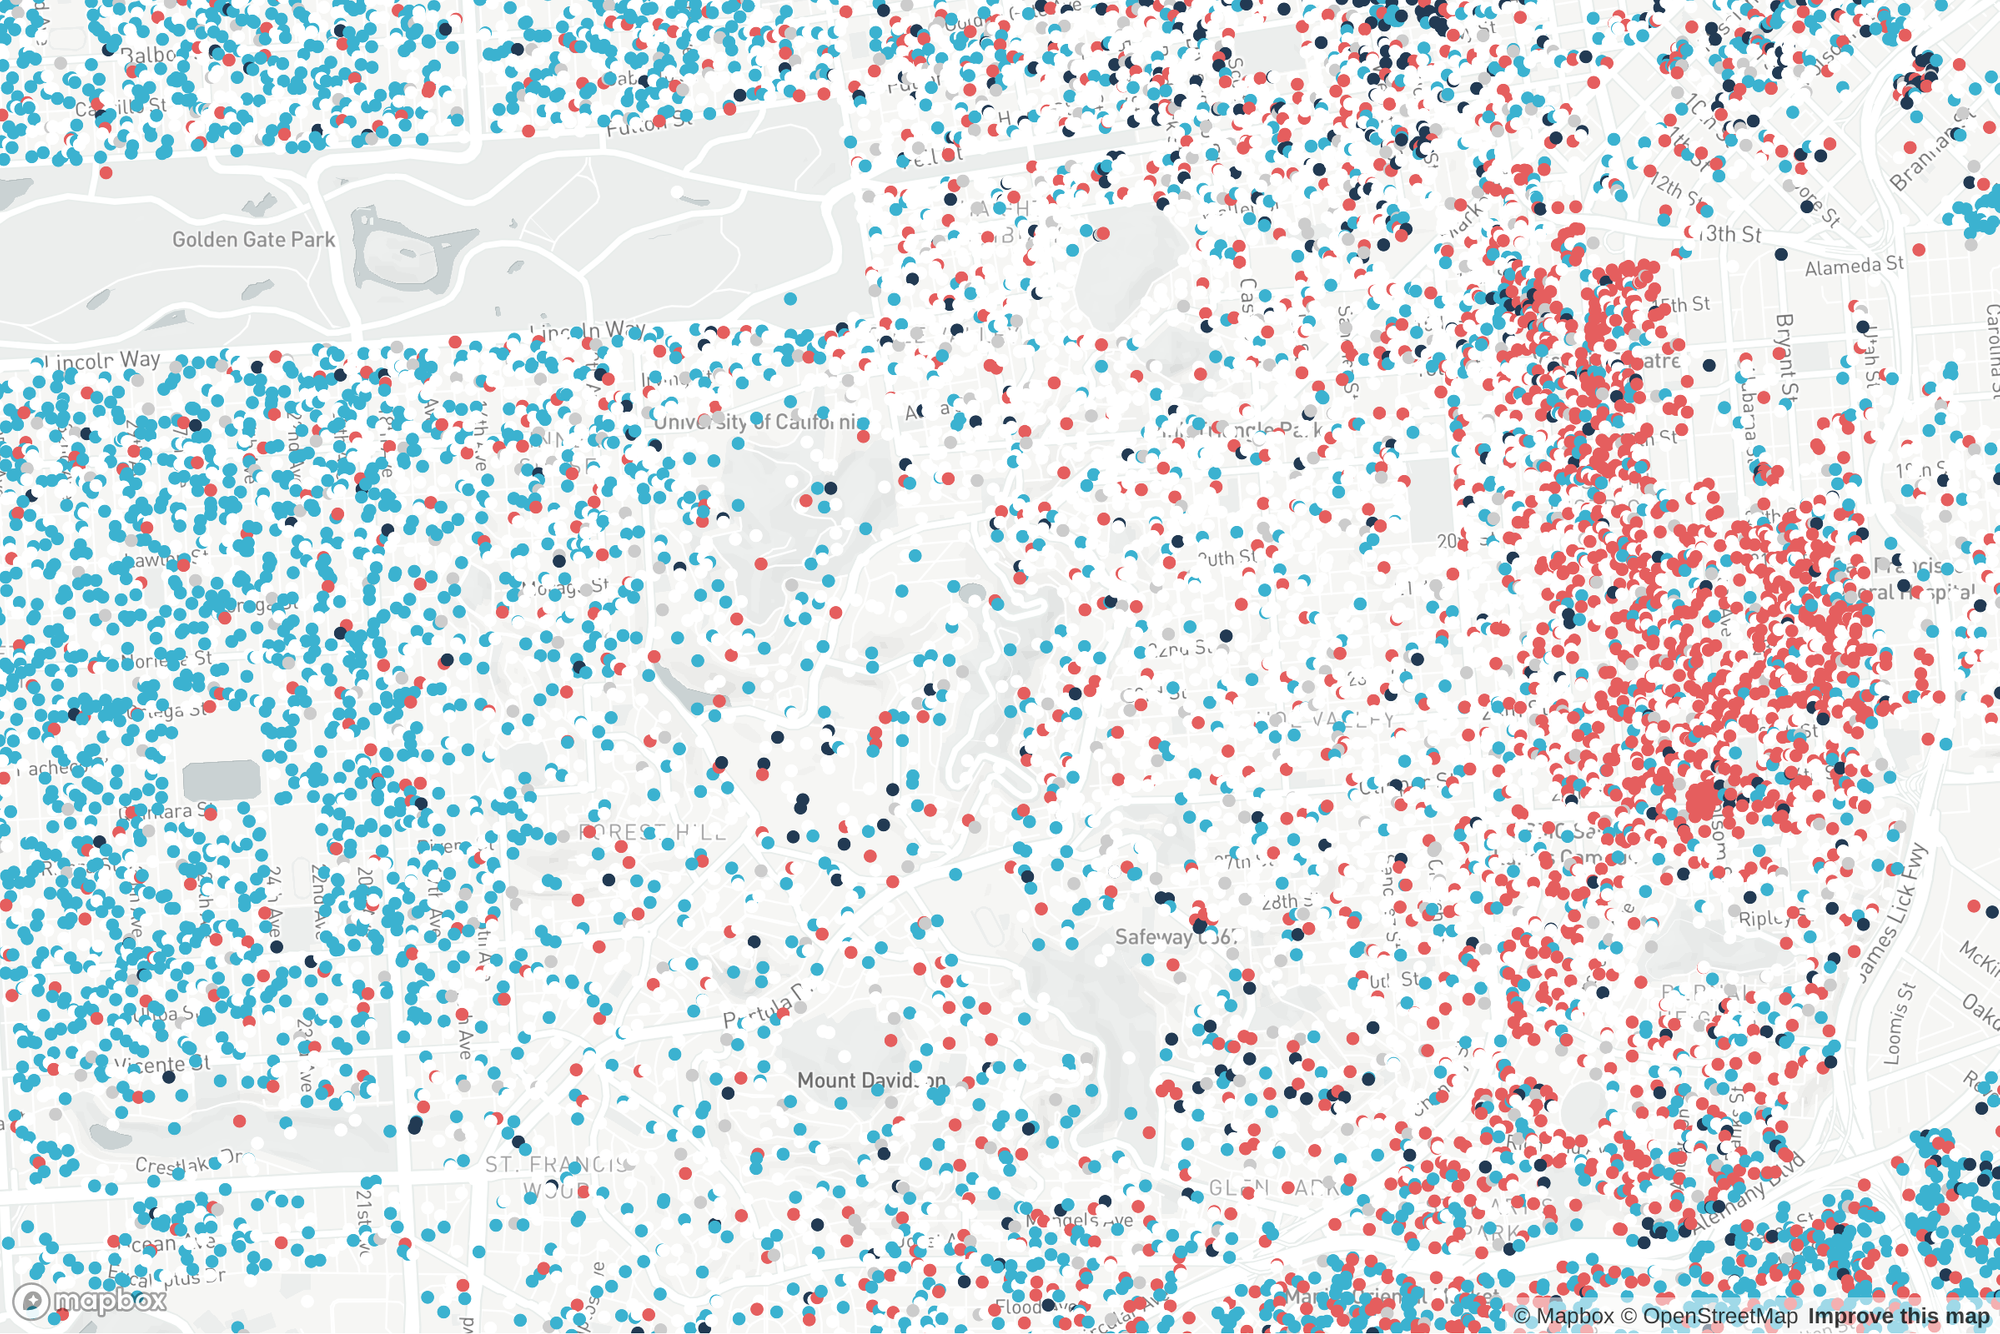
Mapbox provides a nice example for how data driven styling works, which maps out ethnicity data in San Francisco. Check out the code by clicking here, or also pasted below:
<!DOCTYPE html>
<html>
<head>
    <meta charset='utf-8' />
    <title>Style circles with a data-driven property</title>
    <meta name='viewport' content='initial-scale=1,maximum-scale=1,user-scalable=no' />
    <script src='https://api.tiles.mapbox.com/mapbox-gl-js/v1.5.0/mapbox-gl.js'></script>
    <link href='https://api.tiles.mapbox.com/mapbox-gl-js/v1.5.0/mapbox-gl.css' rel='stylesheet' />
    <style>
        body { margin:0; padding:0; }
        #map { position:absolute; top:0; bottom:0; width:100%; }
    </style>
</head>
<body>

<div id='map'></div>
<script>
mapboxgl.accessToken = '<your access token here>';
var map = new mapboxgl.Map({
    container: 'map',
    style: 'mapbox://styles/mapbox/light-v10',
    zoom: 12,
    center: [-122.447303, 37.753574]
});

map.on('load', function () {

    /* Sample feature from the `examples.8fgz4egr` tileset:
       {
           "type": "Feature",
           "properties": {
               "ethnicity": "White"
           },
           "geometry": {
               "type": "Point",
               "coordinates": [ -122.447303, 37.753574 ]
           }
       }
     */
    map.addLayer({
        'id': 'population',
        'type': 'circle',
        'source': {
            type: 'vector',
            url: 'mapbox://examples.8fgz4egr'
        },
        'source-layer': 'sf2010',
        'paint': {
            // make circles larger as the user zooms from z12 to z22
            'circle-radius': {
                'base': 1.75,
                'stops': [[12, 2], [22, 180]]
            },
            // color circles by ethnicity, using a match expression
            // https://docs.mapbox.com/mapbox-gl-js/style-spec/#expressions-match
            'circle-color': [
                'match',
                ['get', 'ethnicity'],
                'White', '#fbb03b',
                'Black', '#223b53',
                'Hispanic', '#e55e5e',
                'Asian', '#3bb2d0',
                /* other */ '#ccc'
            ]
        }
    });
});
</script>

</body>
</html>
If you haven't already received an access token from Mapbox, you can signup for one here.
Mapbox examples are easy to get started, as you can get up and running simply by copying their code into a text file and saving with an html extension (e.g. mapbox-demo.html). You will just need to add your access token, by finding this line in the code, and adding it:
mapboxgl.accessToken = '<your access token here>';How the Styling Works
Circle Radius
Stops
By default, this allows you to set radius based on zoom level. The format is: [[zoom, size], [zoom, size]].
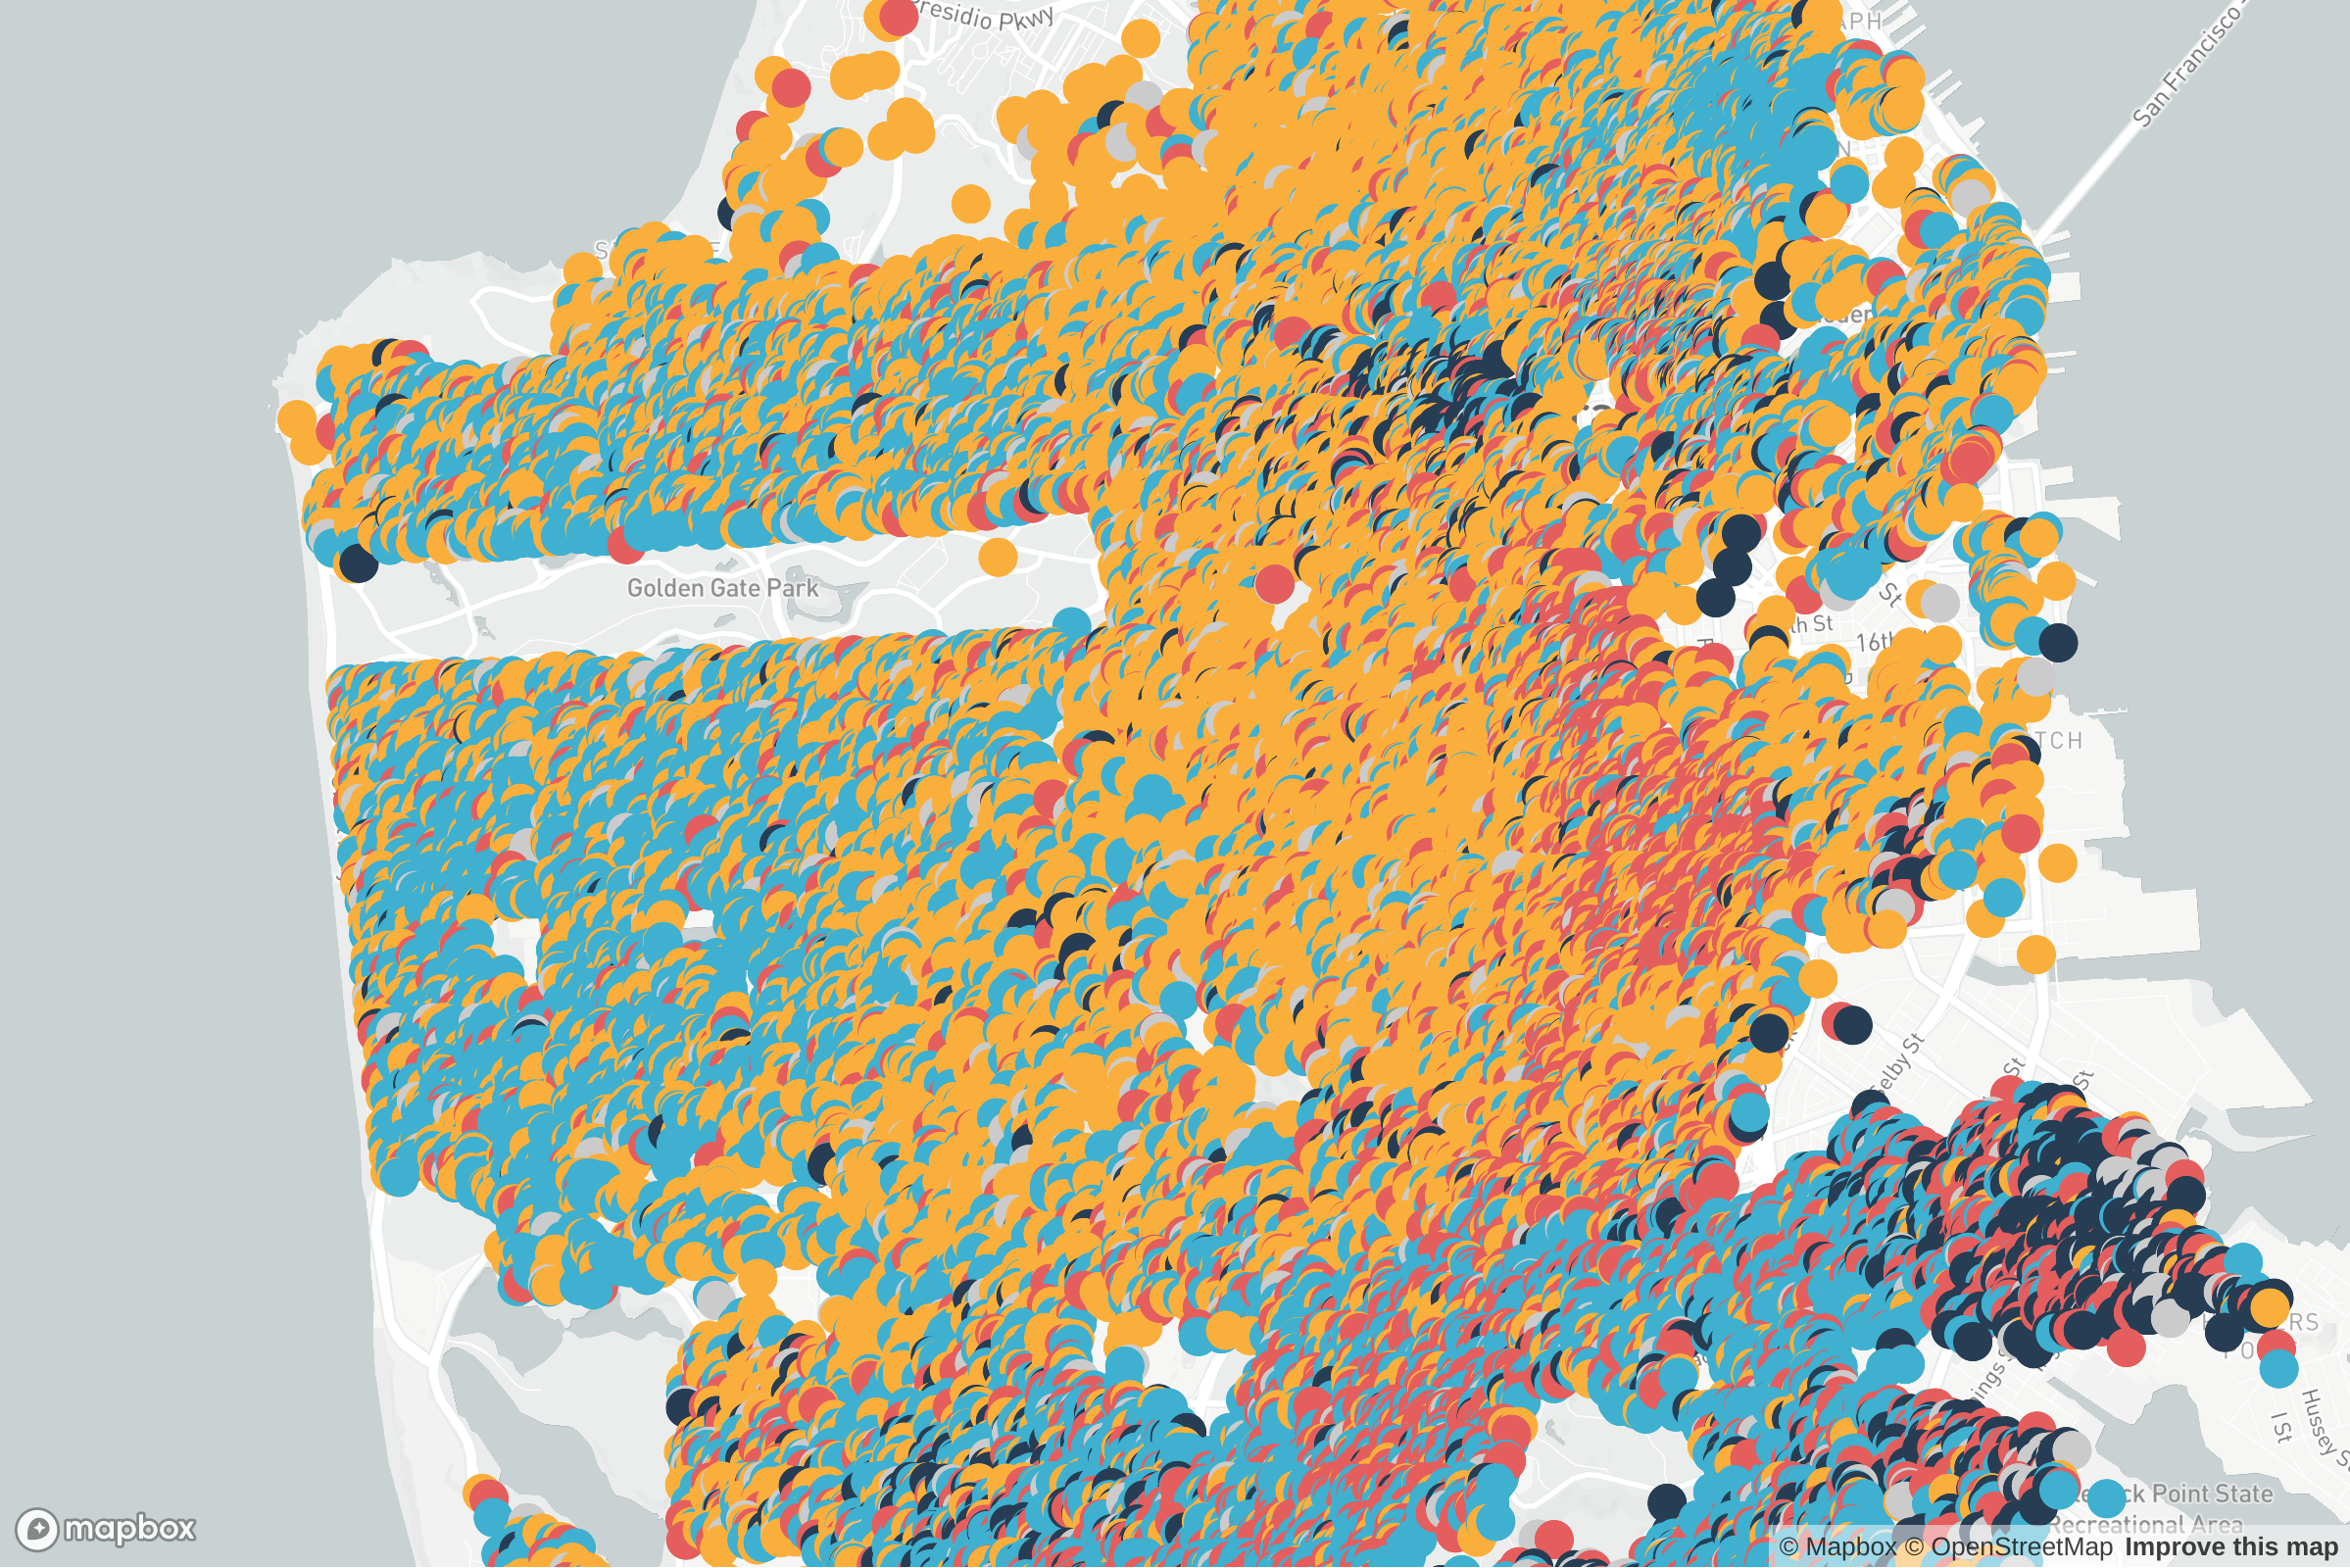
To demonstrate this, let's change our stops to be from zoom level 12 to 14, so we can see a more dramatic shift:
'circle-radius': {
	'base': 1.75,
	'stops': [[12, 2], [14, 180]]
}
Now, if you zoom in just a little, here's the result:
Base
The base is the rate at which the transition takes between stops. It defaults to 1, which is a linear rate. You can go above or below that for an exponential rate in either direction.
To demonstrate this, lets initiate our map to load at a zoom level exactly in between our stops, at 13:
var map = new mapboxgl.Map({
    container: 'map',
    style: 'mapbox://styles/mapbox/light-v10',
    zoom: 13,
    center: [-122.447303, 37.753574]
});
From here, we can try base levels of both 1 and 100, and compare how they look on loading:
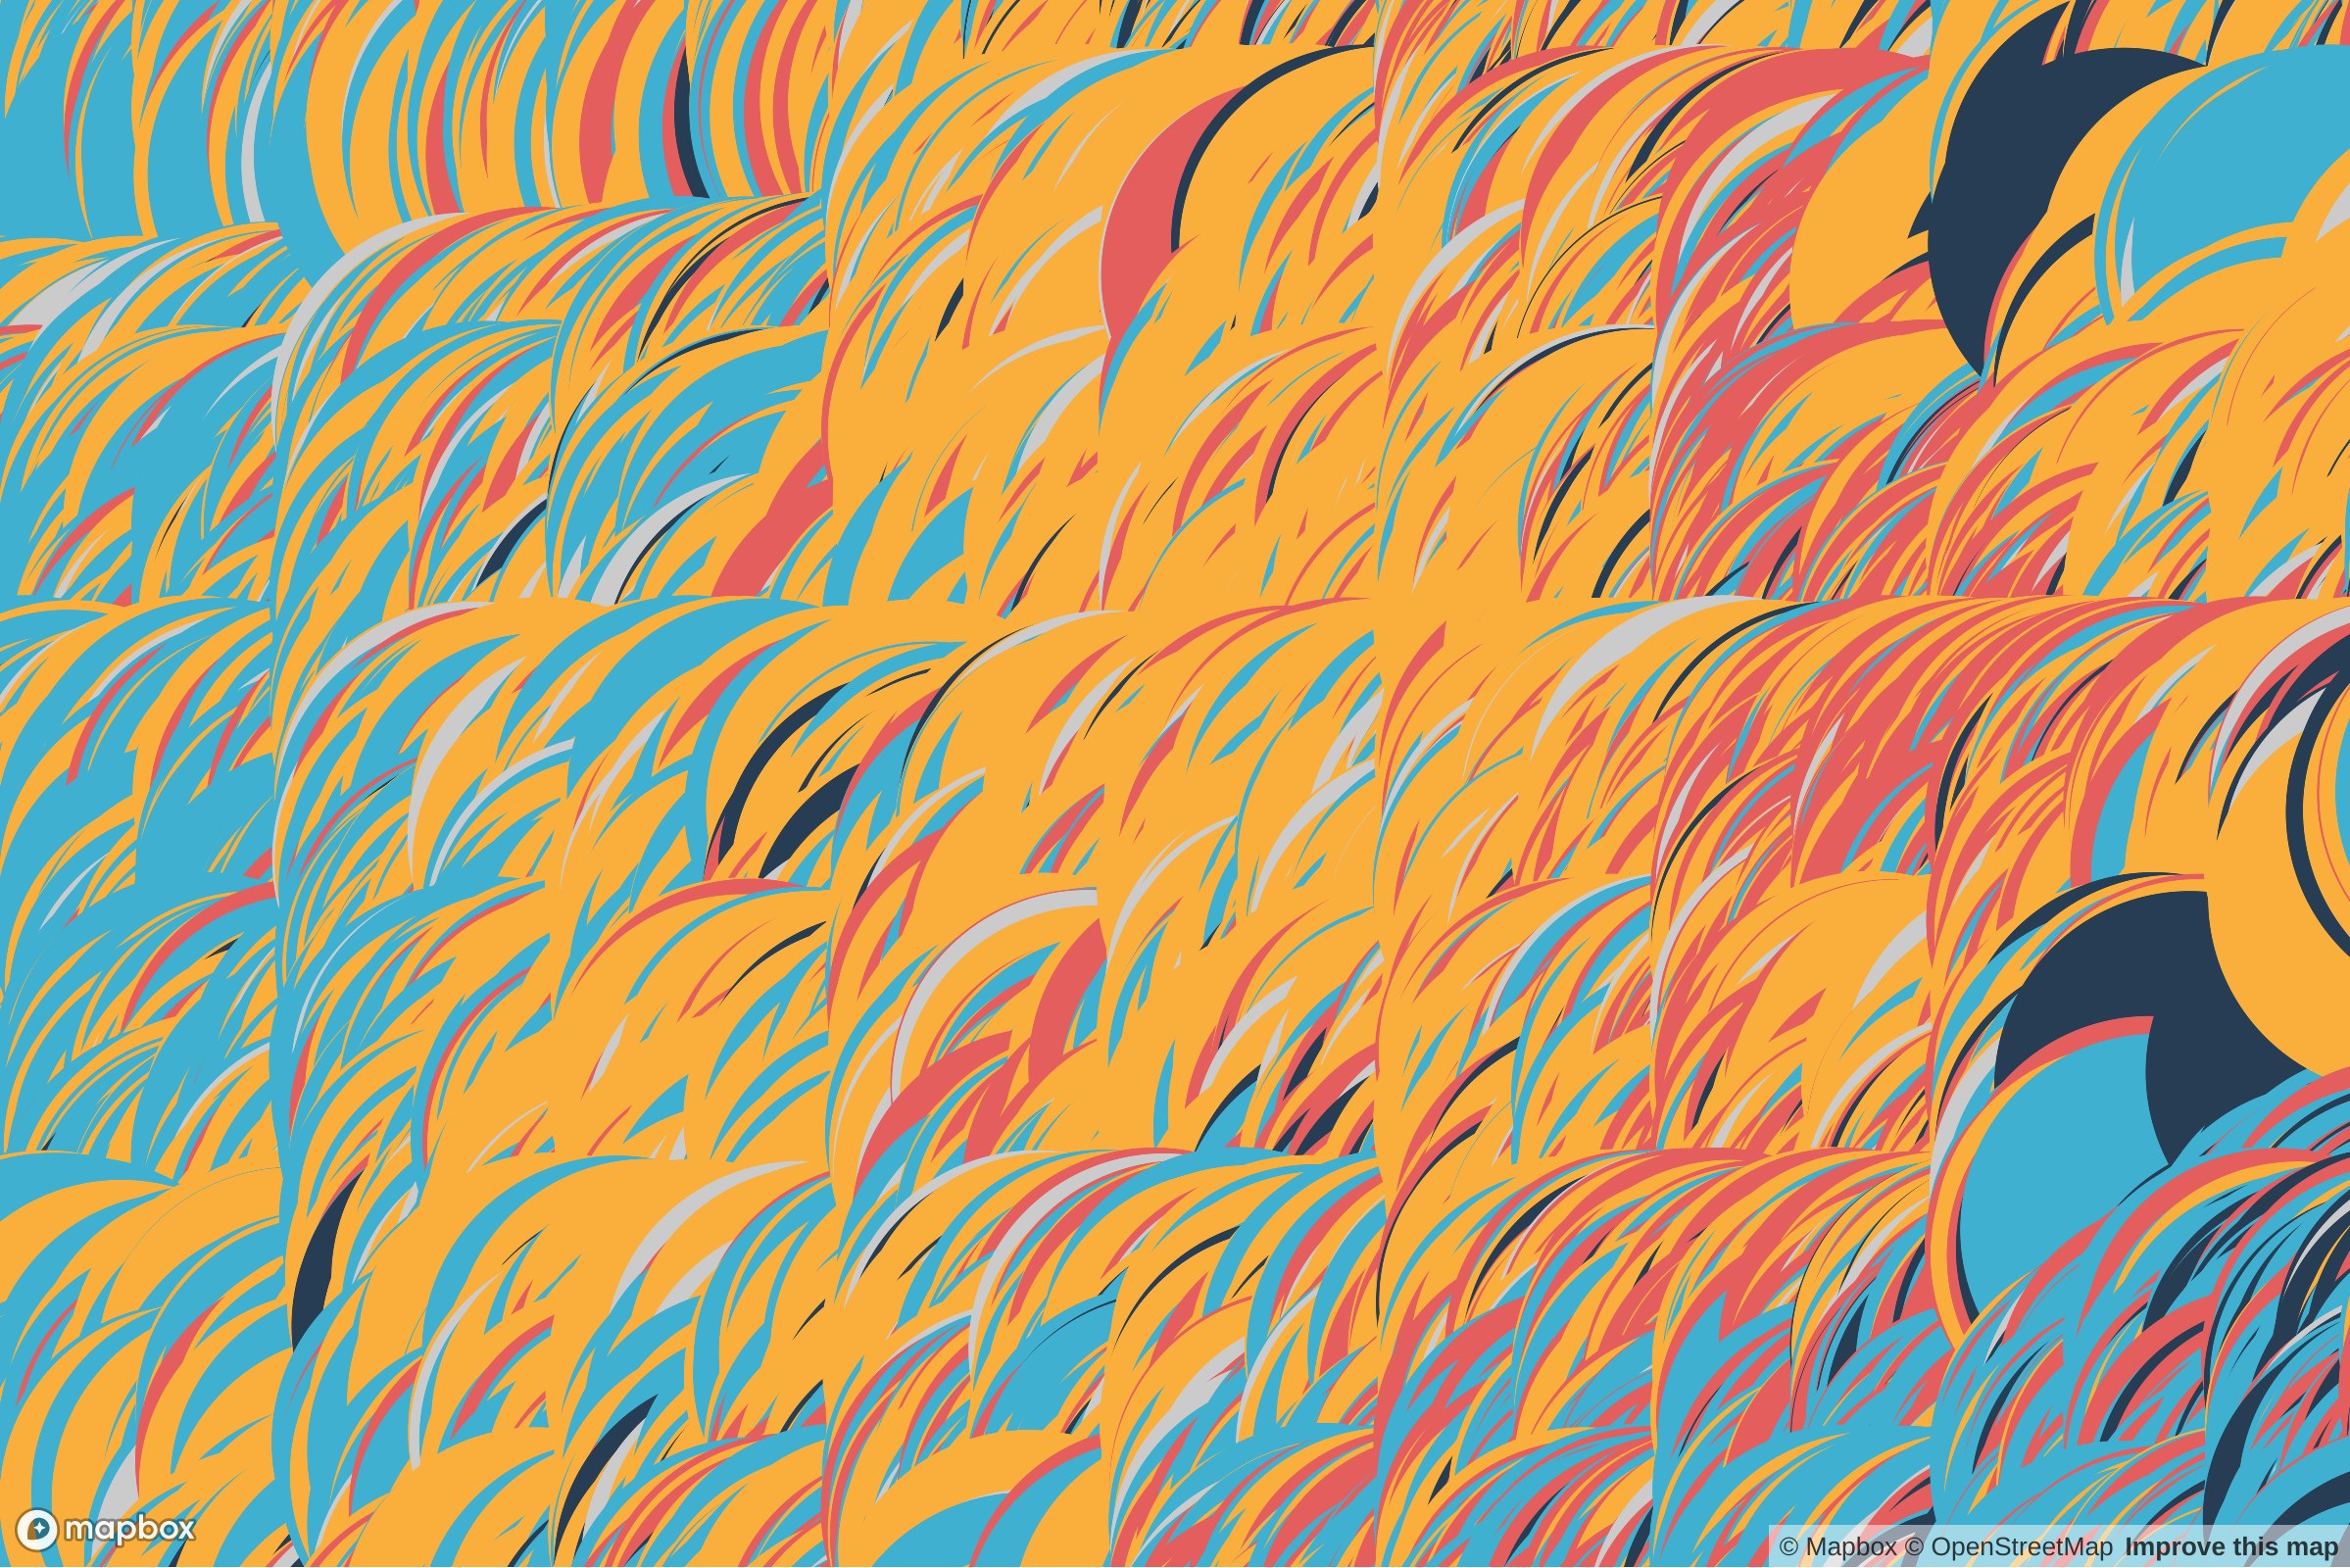
Pretty dramatic difference! Setting the base to 1 gives us a linear relationship, so the dot size is half way between the set points on your stops. Moving the base to 100 gives us a more exponential curve, hence the dots are still small when loaded at midpoint, but will sharply increase as you near the stop setting.
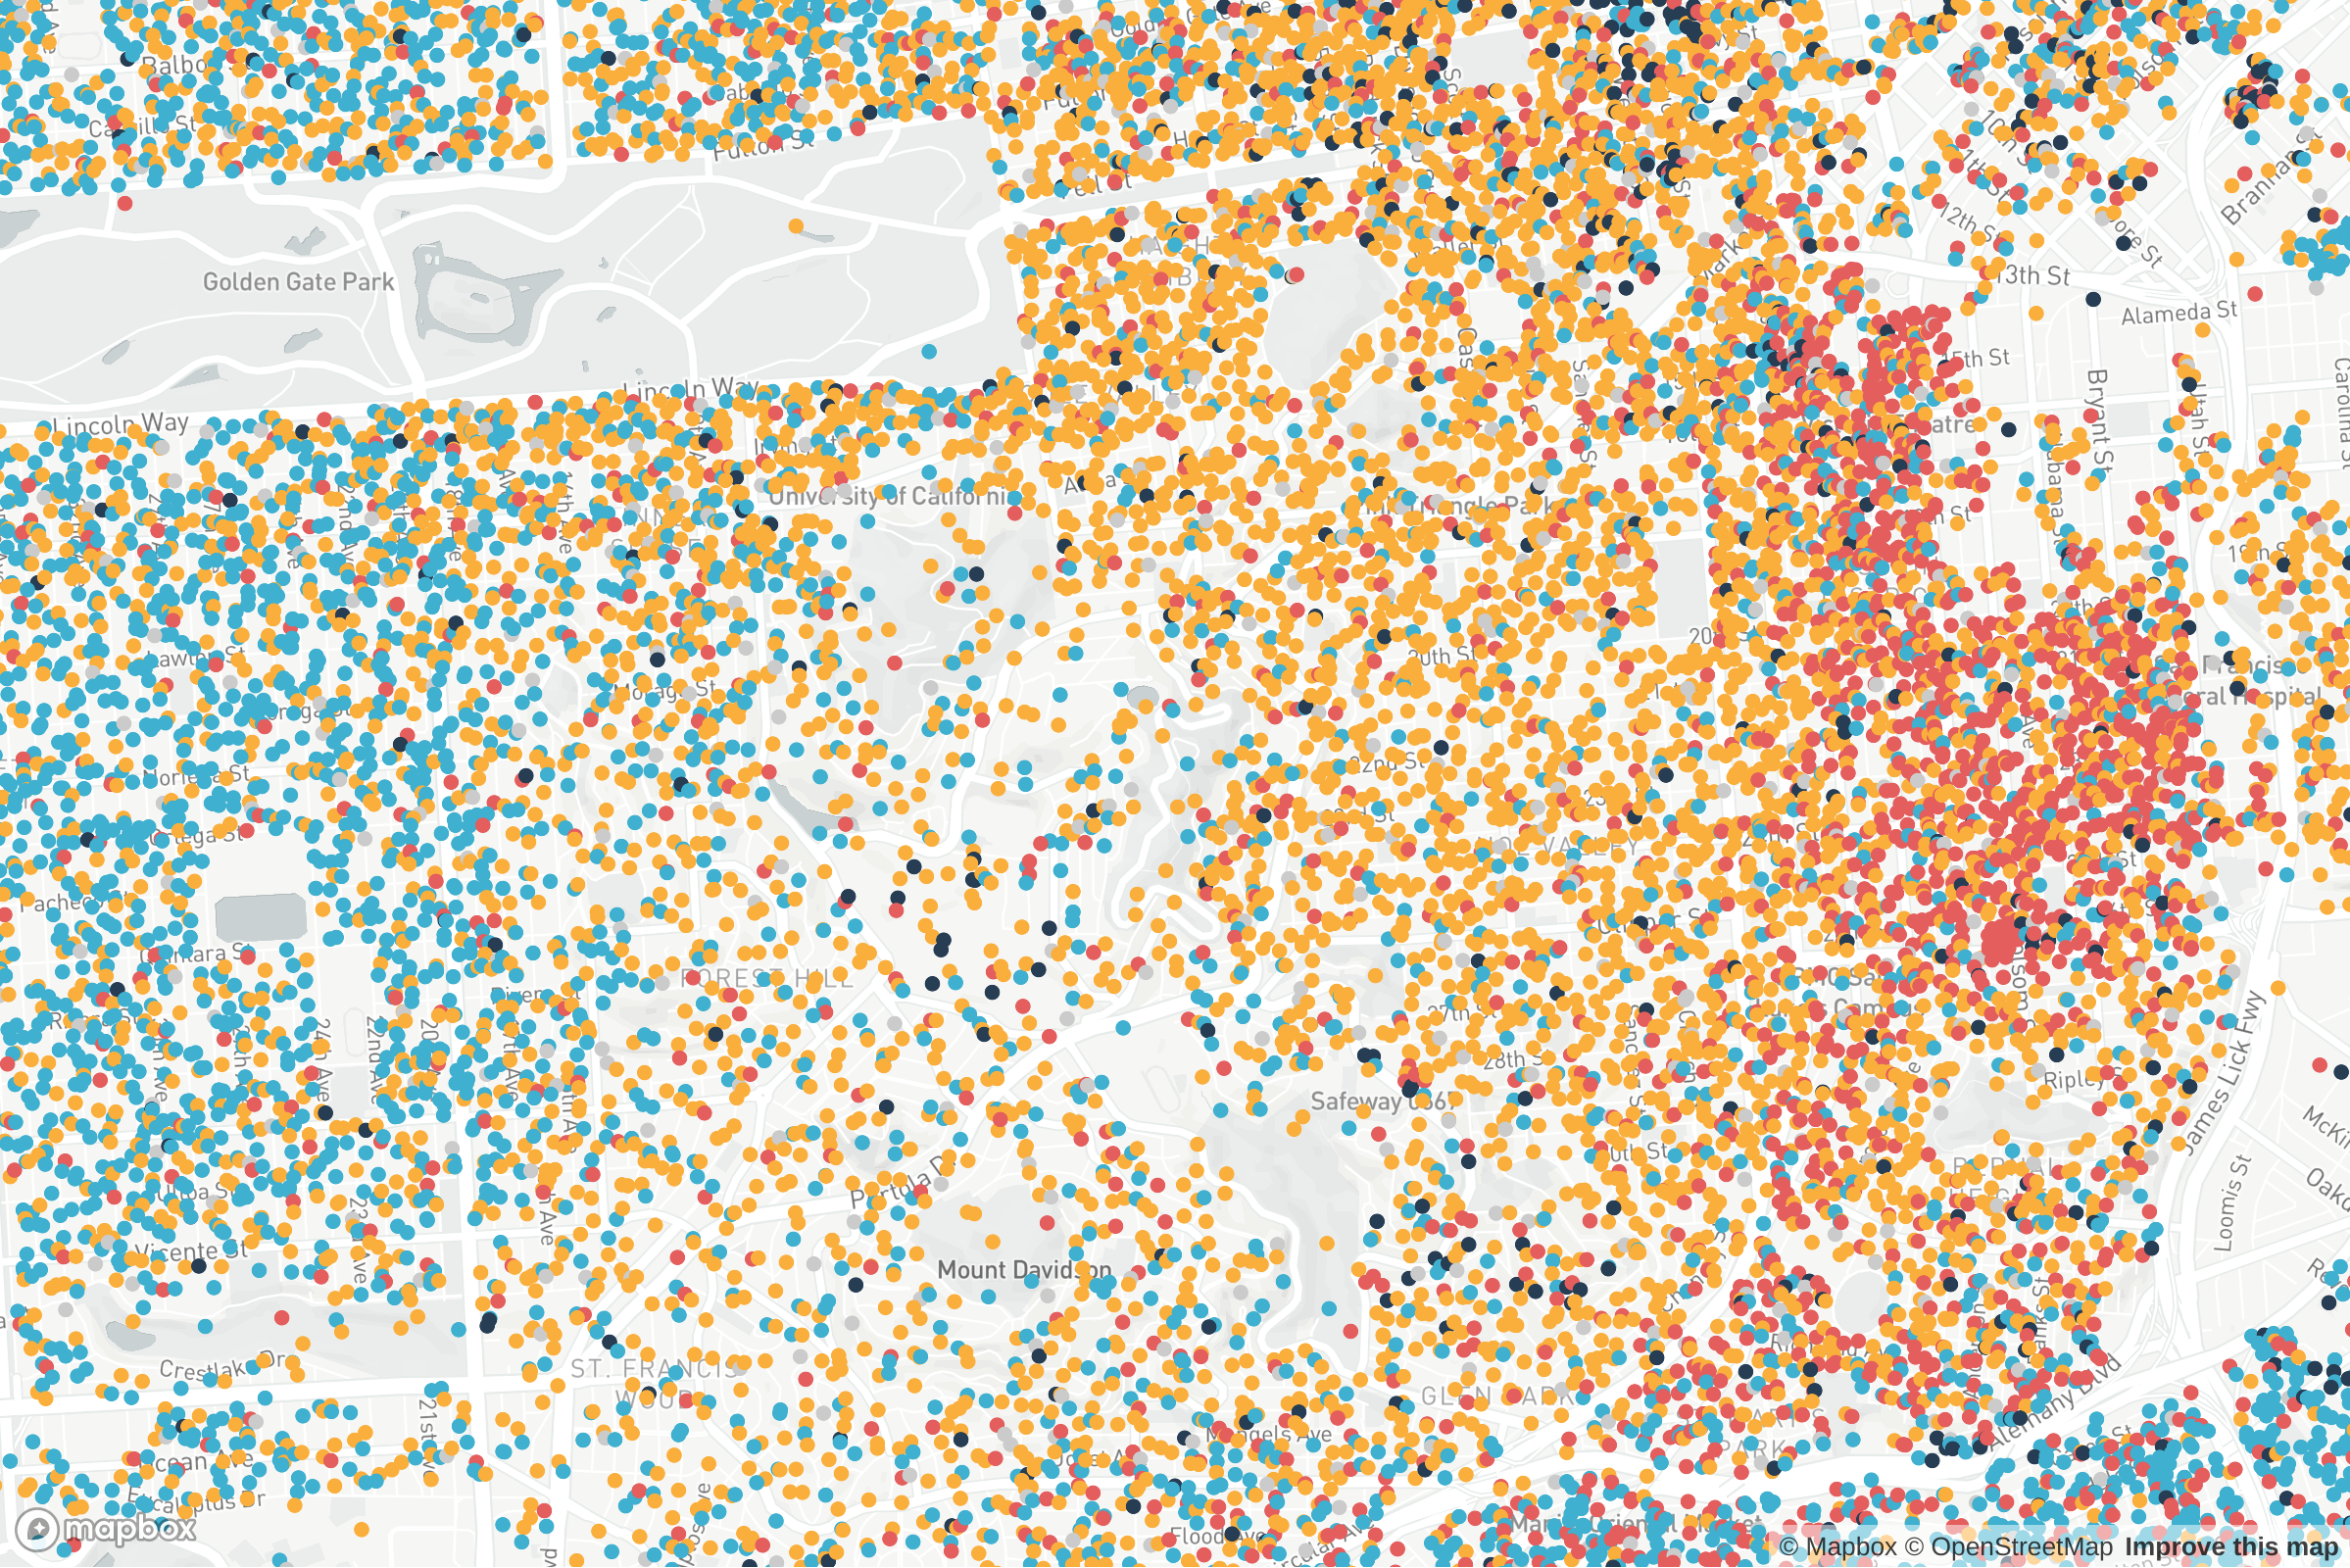
Circle Color
The circle color property is more straight forward and should just match the color to a given string property in the geojson object.
The format is: ['match',['get', object key], object value, color,...]
The given json object has the following values for ethnicity: White, Black, Hispanic, Asian. Let's try changing the color for 'White' to be white:
'circle-color': [
    'match',
    ['get', 'ethnicity'],
    'White', '#ffffff', //hex color for white
    'Black', '#223b53',
    'Hispanic', '#e55e5e',
    'Asian', '#3bb2d0',
    /* other */ '#ccc'
]
Now take a look at our map. It's a little more difficult to see, but the yellow dots have now changed to white.
Final Thoughts
The above post just scratches the surface of what Mapbox can do with data driven styling. You can additionally set sizes based on json properties, add map markers and more. Hope this helps you gain a footing with this API. If you find this info helpful and would like more content about Mapbox or data visualizations, please feel free to comment below.
